
When analyzing email campaign reports in the NiceSender interface, you might notice that the Combined Complaints metric includes both Unsubscribed and Spam Reports.
For any email marketer, it’s common knowledge that an unsubscribe is not a complaint. In classical theory, these are two entirely separate metrics. However, in the NiceSender statistics interface—alongside separate metrics for Unsubscribed and Spam Reports—you’ll see a Combined Complaints indicator. This technical solution is tied to how statistics are collected in the modern email industry.
Let’s dive into the technical reasoning behind this approach.
1. The Difference Between Unsubscribed and Spam Reports
First, let’s establish the basics. In email marketing, these two metrics mean fundamentally different things:
- Unsubscribe. A recipient clicks the link in the email to opt out of future mailings. For a business, this is completely normal: it helps clean inactive subscribers from your mailing list and prevents wasting budget on cold contacts.
- Spam Report. A recipient hits the “Report Spam” button in their inbox. This is a critical signal for email service providers (Gmail, Yahoo, etc.), as it negatively impacts your domain reputation and lowers the deliverability of future campaigns.
Tracking these metrics separately is the industry standard. That is why in the detailed reports for each campaign, you will always find these two numbers broken out:
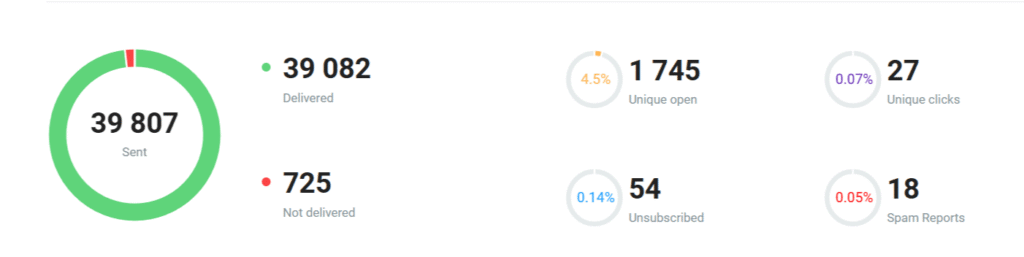
2. The Hidden Data Problem: Why We Don’t See Every Complaint
The main technical hurdle is that email service providers (ESPs) simply cannot record every single click on the “Report Spam” button.
The primary mechanism used to track Spam Reports is Feedback Loops (FBL). But here is the catch: not all inbox providers support or send FBL reports.
- Corporate mail servers rarely send feedback on spam button clicks.
- Many major email providers withhold this data entirely, treating it as internal system information.
This creates a dangerous blind spot: your report might show a reassuring 0.05% spam rate, making you think everything is fine. In reality, another 1% of your recipients may have hit “Spam,” but their inbox providers never notified us. The platform doesn’t see it, you don’t see it—yet your domain reputation takes a hit anyway.
3. The Role of the Combined Complaints Metric
To give you a complete picture of subscriber reactions, we introduced a Combined Complaints metric.
- What it includes: The sum of official Spam Reports (that we managed to capture) PLUS all Unsubscribed.
- Why it matters: It acts as an internal “health index” for your email campaign. It’s not meant to replace standard metrics, but rather to give you a quick answer to one question: “How strongly does this audience want to stop receiving this email?”

Our main goal is to uphold email standards, protect recipients from unwanted mail, and detect spam activities early. We have set a critical threshold of 1% for this combined metric.
For comparison, Google’s strict limit for official spam complaints is 0.3%. Our 1% threshold—which factors in unsubscribes—gives you more room to maneuver while accounting for technical gaps in data collection.
How to Properly Read Combined Complaints: Balancing Unsubscribed vs. Spam Reports
Based on our observations, a healthy email campaign maintains a steady balance between Unsubscribed and Spam Reports. The most valuable analytical insights come from noticing when this balance shifts:
- Warning Signal: Imbalance between Spam Reports and Unsubscribed.
- Situation: Spam Reports are nearly zero (0.01%–0.05%), but the combined metric is approaching 1% due to a high volume of unsubscribes.
- What it means: This is the most dangerous scenario. In reality, actual spam clicks are likely much higher. Recipients are sending emails to spam in bulk, but receiving servers are filtering the messages silently without sending FBL reports. In the dashboard, you only see normal unsubscribes, masking the true damage. This is a clear sign to conduct a thorough audit of your mailing list and content.
- Red Flag: High volume of direct Spam Reports.
- Situation: The direct “Spam“ click rate approaches 0.2%–0.3%.
- What it means: The issue is blatant and unhidden by technical limitations. Numbers like these indicate that your content is irrelevant or the database is stale—recipients are actively expressing dissatisfaction. Your domain is on the verge of being blocklisted, so you must immediately pause sending to this segment and investigate the cause.
- Green Light: All metrics are low.
- Situation: Both Unsubscribed and Spam Reports remain low, with no imbalances.
- What it means: You are sending to an active mailing list, the content is relevant, and your technical configuration is solid. Keep up the good work.
The Combined Complaints metric in NiceSender is a safety net for marketers navigating incomplete data. Its core job is to flag imbalances early and safeguard your sender reputation before your domain ends up on a blocklist.
By understanding how Combined Complaints work in NiceSender, you gain a more powerful analytical tool to help build long-term, respectful relationships with your audience.